Risk Factors in Cardiovascular-related Mortality
Type
Group Project
Method
Data Analysis
Data Regression
Data Visualization
Tool
R Studio
Duration
March 2023 - May 2023
Introduction
The data used for this analysis is the U.S. Chronic Disease Indicators (CDI) dataset. It provides valuable insights into various chronic diseases and health indicators across different states in the United States. The dataset contains information on mortality rates, disease categories, demographics, States, and other relevant factors.
The objective of this analysis is to tell a story about the disparities in cardiovascular-related mortality rates across gender, race/ethnicity, and different states in the U.S. By examining the mortality rates, exploring variations between groups, and analyzing trends over time, we aim to identify patterns and potential factors influencing cardiovascular health outcomes. The analysis will provide insights into the unequal burden of cardiovascular diseases and contribute to efforts in developing targeted interventions and policies for improved public health.
The final dataset consists of the following variables and we used it to create different visualization:
YearStart: The start year of the data collection period, indicating the specific year
when the
mortality data was recorded.
YearEnd: The end year of the data collection period, representing the same year as the
YearStart
variable in this case, indicating that the mortality data is for a specific year.
Question: The question or topic related to the mortality data, specifying the cause of
death or
health condition being investigated.
DataValue: The numeric value representing the mortality rate for the specific question
or
topic. It
provides information about the frequency or rate of deaths related to a particular cause or condition.
DataValueInfoAge-adjusted Rate cases per 100,000: Additional information about the
mortality
rate,
specifically mentioning age-adjusted rate cases per 100,000 people. This variable may be used to compare
mortality rates across different populations with varying age distributions.
DataValueInfoCrude Rate cases per 100,000: Further details about the mortality rate,
specifically
referring to crude rate cases per 100,000 people. This variable represents the unadjusted mortality rate
without considering age differences between populations.
StratificationCategoryGender: Categorization of the data based on gender, indicating
whether
the
mortality data corresponds to males (0) or females (1).
StratificationCategoryRace/Ethnicity: Categorization of the data based on race or
ethnicity,
specifying the racial or ethnic background associated with the mortality data.
Stratification: Further sub-categorization of the data, providing additional details
about the
stratification or classification related to gender and race/ethnicity.
State: The state in the United States where the mortality data was collected or
recorded.
Latitude: The latitude coordinate associated with the location where the mortality data
was
collected.
Longitude: The longitude coordinate associated with the location where the mortality
data was
collected.
Exploratory Analysis
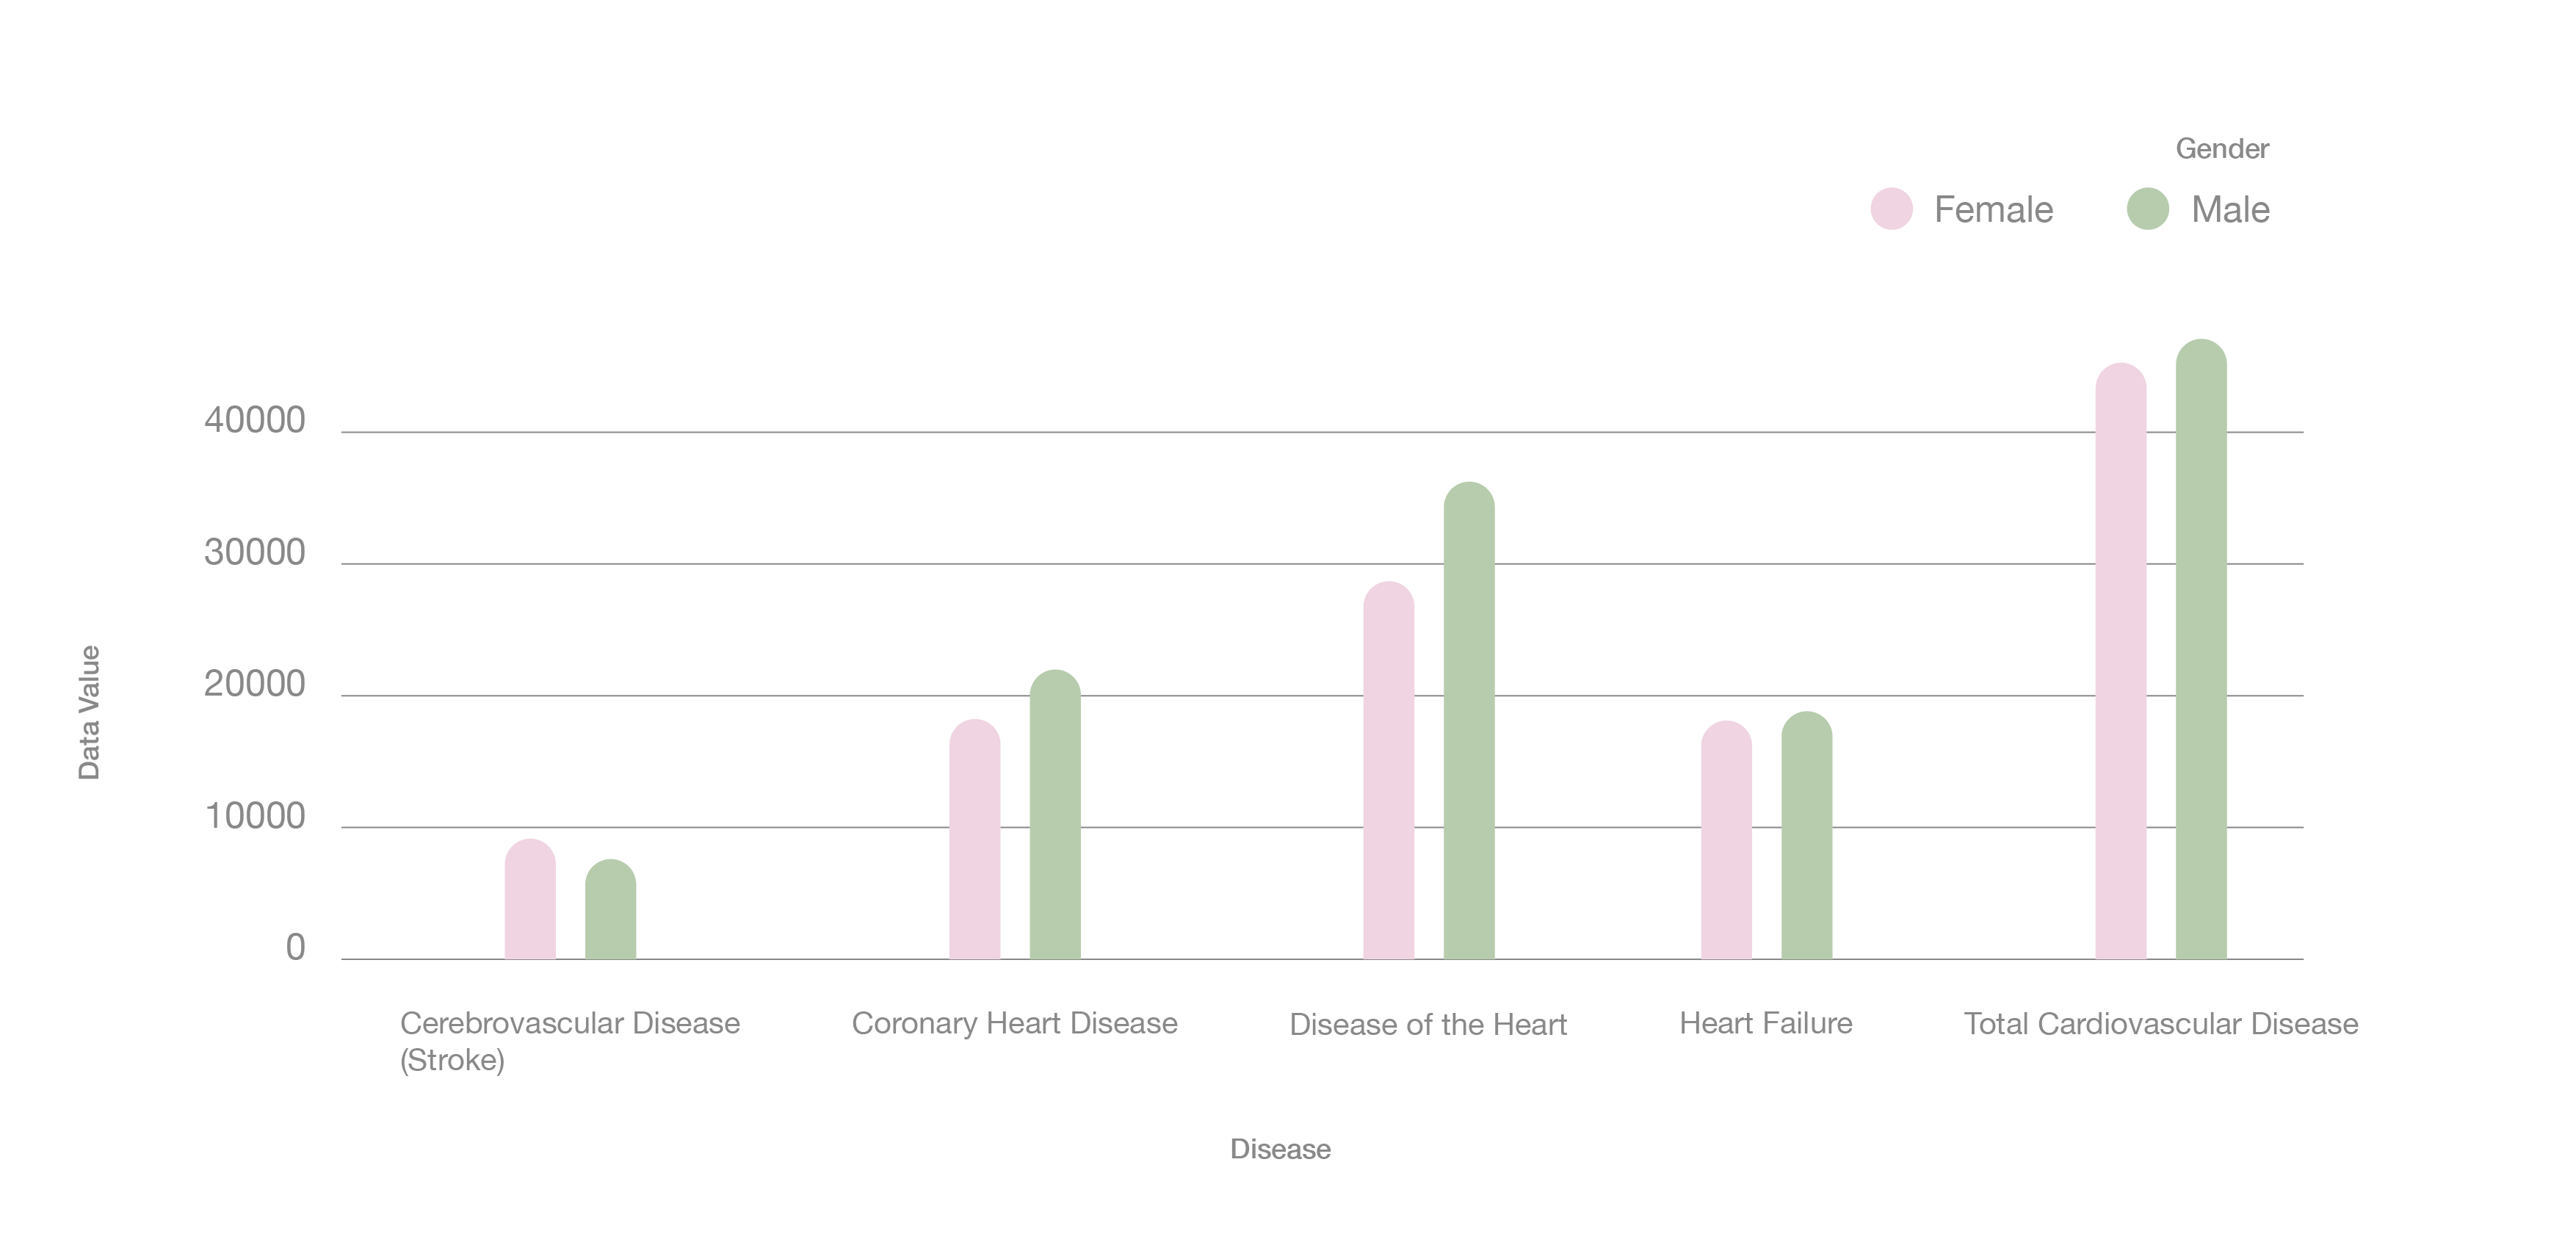
Mortality Rates by Gender
This chart displays the mortality rates for different disease categories, such as heart disease, stroke, and others, on the y-axis, while the x-axis represents the gender groups. By examining this visualization, we noticed variations in mortality rates between males and females for different disease categories. This led us to explore further and delve into the gender differences in cardiovascular-related mortality.
Mortality Rates Over Time
This line plot depicts the changes in mortality rates over time for cardiovascular diseases. Analyzing this visualization, we observed trends and fluctuations in mortality rates across different time periods, which raised questions about potential factors influencing these variations.
Mortality Rates by Race/Ethnicity
This bar chart illustrates the mortality rates of cardiovascular diseases among various race/ethnicity groups. Upon reviewing this visualization, we identified disparities in mortality rates across different racial and ethnic populations, prompting us to explore the potential underlying factors contributing to these differences.

Visualizations
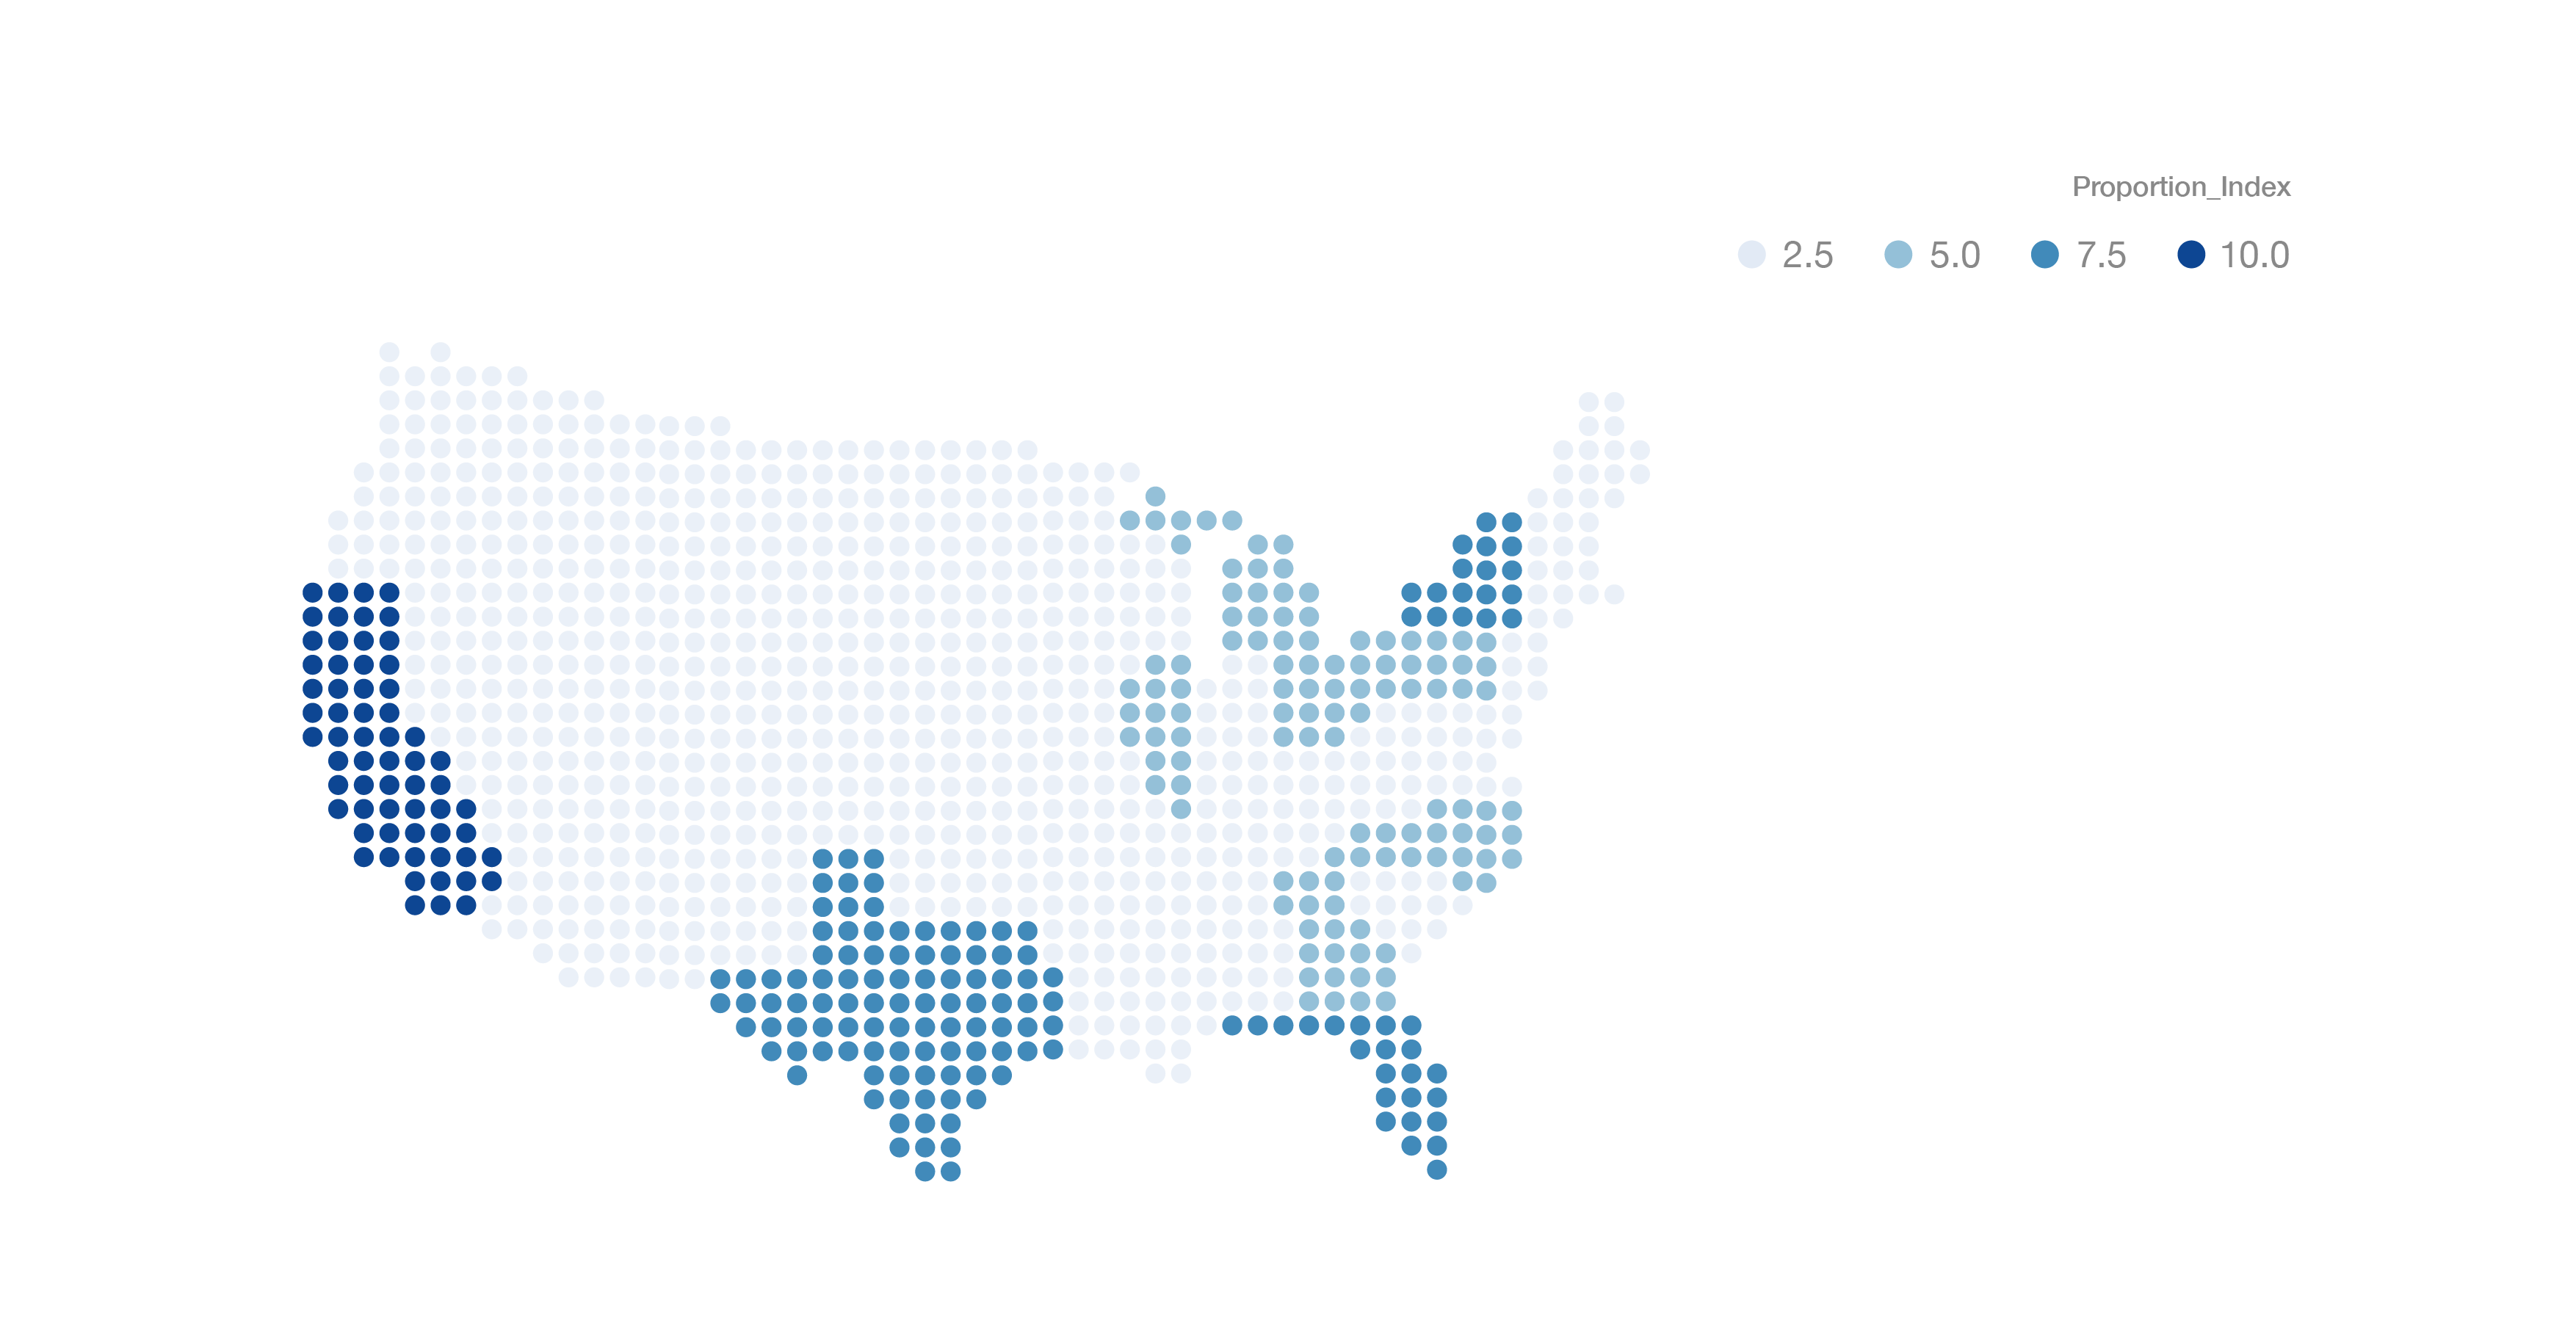
Average Proportion of Cardiovascular-related Mortality per State
Mortality Rate by Gender
Mortality Rate Over the Time

Mortality Percentage Rates by Race/Ethnicity

Takeaways